Flowire Monitoring
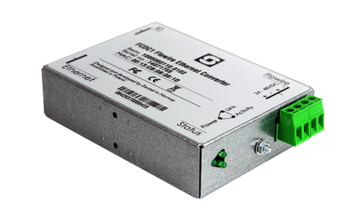
This article describes how to enable monitoring for the [1] that are connected to the Exigo system.
Monitoring the Flowires will provide better error reporting and easier troubleshooting if an error should occur.
EMT Configuration
Monitoring of the Flowires must be configured using EMT.
- Go to Configuration view
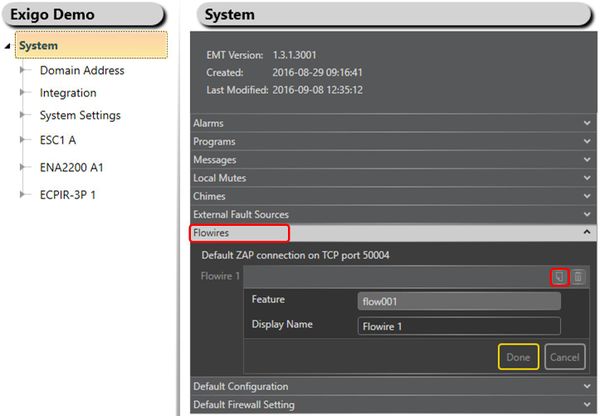
- In the device tree, go to System > Flowires
- Click the Add button (beside the trashcan) to add a new Flowire to the system.
- Click the Trashcan button to remove monitoring of the selected Flowire.
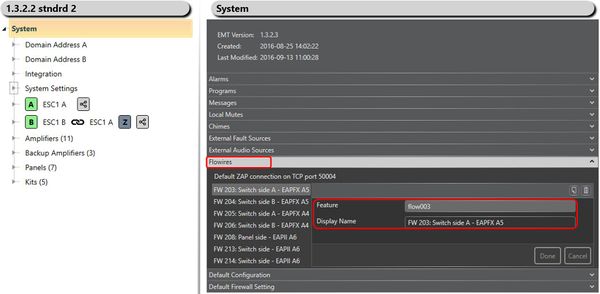
Feature: This is automatically generated by EMT. The first Flowire will have flow001, the next flow002 and so on.
Display Name: It is recommended to give the Flowire a descriptive name. The name will be displayed in the fault list if a Flowire loses a connection.
A good descriptive name will make it easier to troubleshoot if a fault occurs.
Flowire Configuration
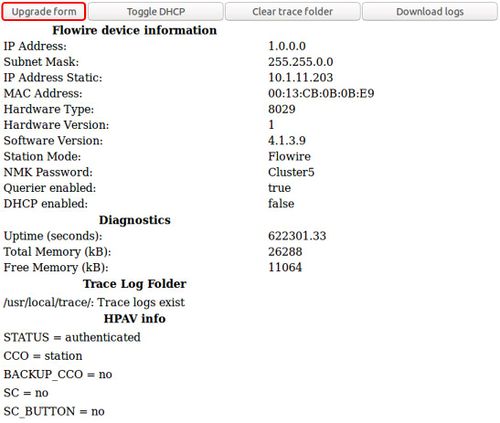
Configuration of the Flowire is done via the web interface of the Flowire.
If there is no DHCP server on the network, the Flowire unit will, by default, have a static IP address 169.254.1.10.
- Log into the web interface of the Flowire
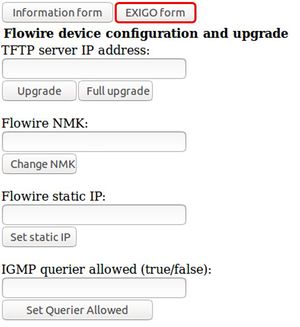
- Click the Upgrade form button
- Click the EXIGO form button
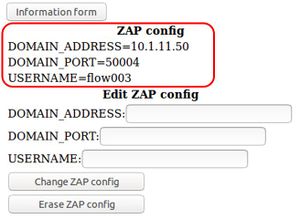
Enter values for the following configuration parameters:
DOMAIN_ADDRESS: This is the IP address of the Primary System Controller (PSC).
DOMAIN_PORT: This is the ZAP port number being used by Exigo. The default port number is 50004.
USERNAME: The username is the Feature that is automatically generated by EMT. The first Flowire will have flow001, the next flow002 and so on.
Availability
This function is available from Exigo 1.3 and later.
