EMT Monitoring
This article describes the monitoring feature in EMT.
Contents
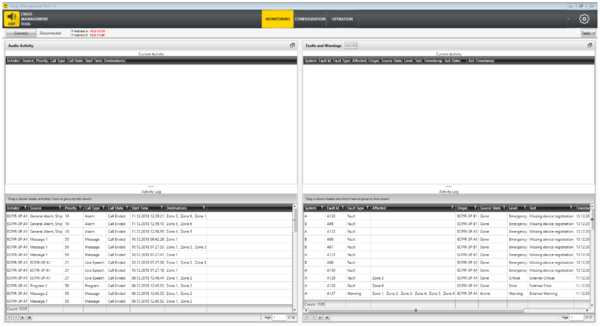
Monitor View
To enter the monitor view select Monitoring in the top banner.
Connect and Disconnect
In order to connect to the system click on the Connect button:
When connection is established, the IP address(es) will turn green, and the button will show Disconnect.
Monitoring Sections
Audio Activity
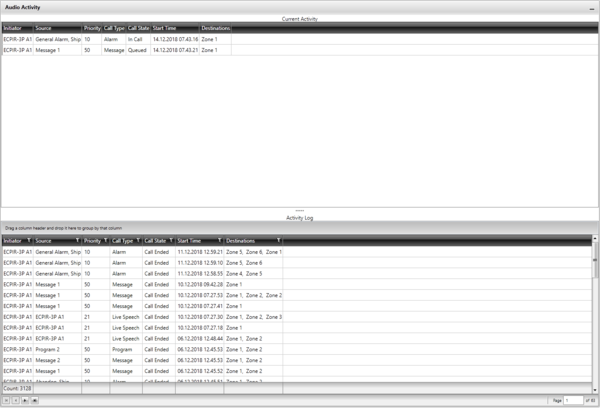
The Audio Activity section will show current (ongoing) calls in the top part and terminated calls in the bottom part of the view.
The Audio Activity view are paginated with 50 records per page.
There is information about total number of records and buttons to navigate to first/previous/next/last page at the bottom of the view.
Faults and Warnings
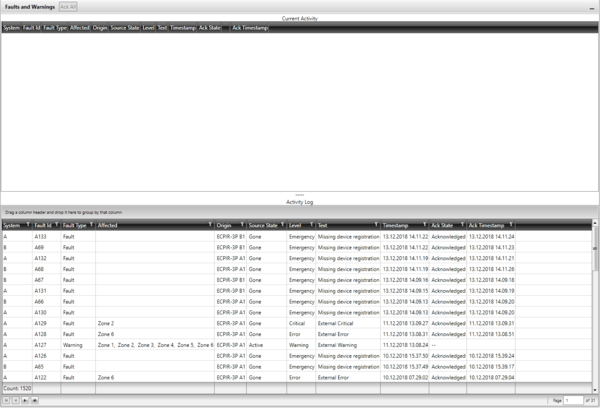
The Faults and Warnings section will show current Faults and Warnings in the top part and a log of Faults and Warnings at the bottom.
The Faults and Warnings view are paginated with 50 records per page.
There is information about total number of records and buttons to navigate to first/previous/next/last page at the bottom of the view.
Maximizing and Minimizing views
The Audio Activity and Faults and Warnings View can be maximized to get more space for the list. To maximize, click the Maximize icon:
To minimize, click the Minimize icon:
When one of the lists is maximized, the other view will be displayed with just a summary of current activity.
Acknowledge and Reset faults
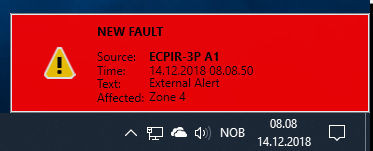
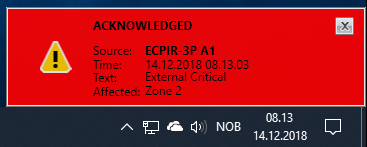
When a fault or warning arrives, EMT will display a popup window in the corner of the main screen.
A fault can be acknowledged by clicking in the center area of the popup.
Once the fault is acknowledged, the popup will automatically close after 5 seconds, or it can be closed manually by clicking the “X” icon on the popup.
Faults can also be acknowledged from the Current Activity list in the Faults and Warnings view:
When the fault is acknowledged, it can be reset:
Sorting, Filtering and Grouping
Options
Availability
This function is available from Exigo Management Tool (EMT) 1.5.3.0 and newer.
