Difference between revisions of "EMT Monitoring"
(→Prerequisite) |
(→Prerequisite) |
||
| (2 intermediate revisions by the same user not shown) | |||
| Line 2: | Line 2: | ||
== Prerequisite == | == Prerequisite == | ||
| − | To install EMT 1.5.3.0 run the '''VS-EMT Setup.exe''' file. <br> | + | To install [[Downloads#Exigo_Management_Tool_1.5.3.0|EMT 1.5.3.0]] run the '''VS-EMT Setup.exe''' file. <br> |
| − | The rest of the Exigo system must run the latest Exigo firmware. <br> | + | The rest of the Exigo system must run the latest Exigo firmware release. <br> |
| − | Latest Exigo release and EMT 1.5.3.0 can be found [[Downloads|here]]. | + | Latest Exigo release and [[Downloads#Exigo_Management_Tool_1.5.3.0|EMT 1.5.3.0]] can be found [[Downloads|here]]. |
== Monitor View == | == Monitor View == | ||
Latest revision as of 11:58, 3 April 2020
This article describes the monitoring feature in EMT.
Contents
Prerequisite
To install EMT 1.5.3.0 run the VS-EMT Setup.exe file.
The rest of the Exigo system must run the latest Exigo firmware release.
Latest Exigo release and EMT 1.5.3.0 can be found here.
Monitor View
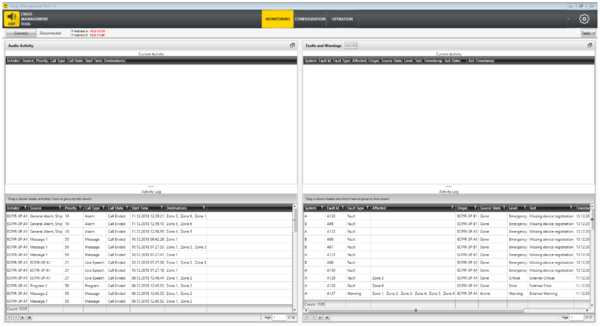
To enter the monitor view select Monitoring in the top banner.
Connect and Disconnect
In order to connect to the system click on the Connect button:
When connection is established, the IP address(es) will turn green, and the button will show Disconnect.
Monitoring Sections
Audio Activity
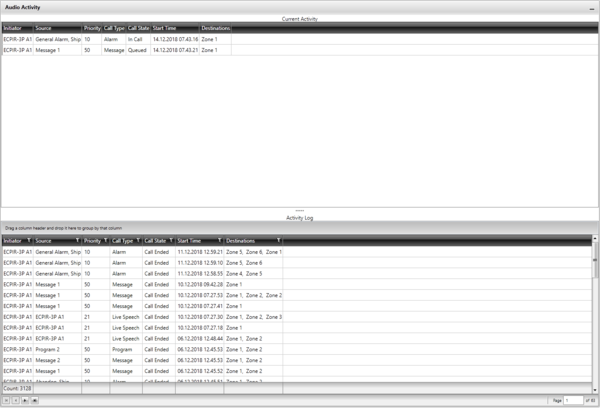
The Audio Activity section will show current (ongoing) calls in the top part and terminated calls in the bottom part of the view.
The Audio Activity view are paginated with 50 records per page.
There is information about total number of records and buttons to navigate to first/previous/next/last page at the bottom of the view.
Faults and Warnings
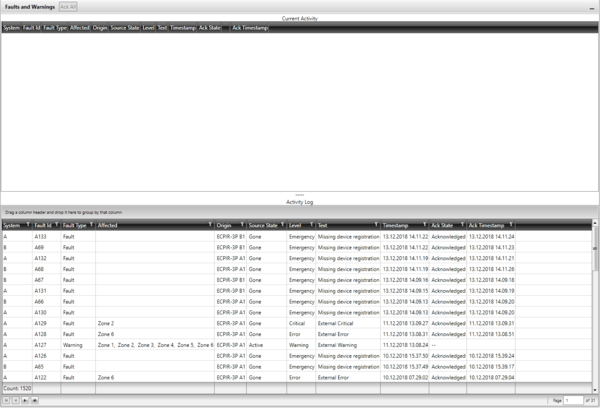
The Faults and Warnings section will show current Faults and Warnings in the top part and a log of Faults and Warnings at the bottom.
The Faults and Warnings view are paginated with 50 records per page.
There is information about total number of records and buttons to navigate to first/previous/next/last page at the bottom of the view.
Maximizing and Minimizing views
The Audio Activity and Faults and Warnings View can be maximized to get more space for the list. To maximize, click the Maximize icon:
To minimize, click the Minimize icon:
When one of the lists is maximized, the other view will be displayed with just a summary of current activity.
Acknowledge and Reset faults
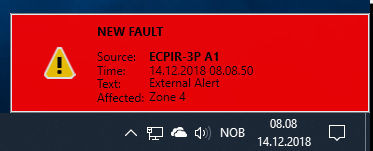
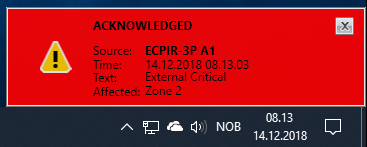
When a fault or warning arrives, EMT will display a popup window in the corner of the main screen.
A fault can be acknowledged by clicking in the center area of the popup.
Once the fault is acknowledged, the popup will automatically close after 5 seconds, or it can be closed manually by clicking the “X” icon on the popup.
Faults can also be acknowledged from the Current Activity list in the Faults and Warnings view:
When the fault is acknowledged, it can be reset:
Warning Popup
The warning popup will automatically close after 5 seconds, or it can be manually closed by clicking the “X” icon on the popup.
Sorting, Filtering and Grouping
Sorting
Click column header to sort. Sort options are ascending, descending and default order.
Filtering
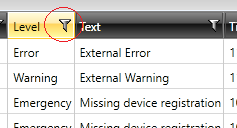
Click on filter icon in column header.
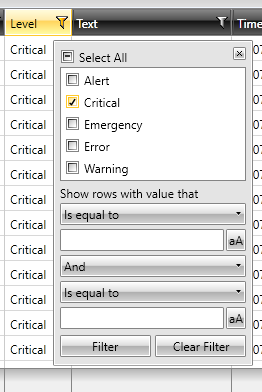
The Filter dialog will now open.
In the filter dialog, it is possible to make a simple filter by selecting from the top list, or to make filters that are more complex by filling in the values below.
Grouping
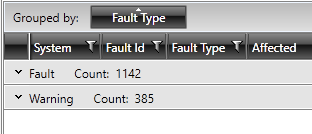
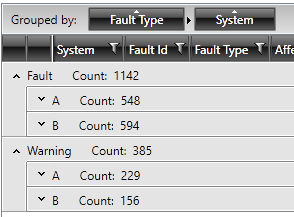
The Activity Logs view can be grouped by dragging a column header to the area above the column headers:
This will result in the Activity Log being grouped by the values in the column:
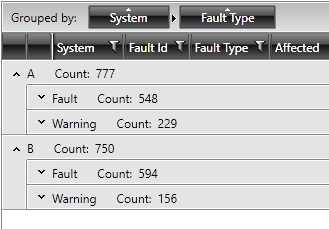
The Activity Log can be grouped by multiple values:
The grouping can be reordered to get a view that displays data exactly as wanted.
Export
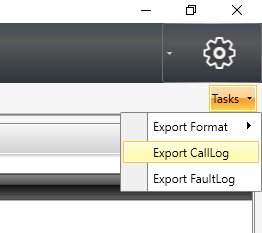
It is possible to export all the log entries to Excel or Csv file.
Use the Tasks button in the upper right corner:
The submenu Export Format lets you select if the log files should be exported to Excel (.xlsx) or Comma Separated Values (.csv) file.
Options
There are a few options available that controls some of the Monitoring functionality.
Options are available at Options -> Configuration Options:
EMT is monitoring the connection to the controller(s) by periodically sending a Ping and checking if the controller replies.
On slow connections (remote, VPN,…) it can be necessary to adjust the ping settings.
- Ping Every: set how often EMT should send a Ping (ping every 1-10 second, default 2)
- Ping Timeout: set how long EMT should wait for reply (100 – 10000ms, default 500ms)
- Ping Retries: If a reply is missed, EMT will retry a ping a number of times before the connection to the controller is reported as lost (0-5 retries, default 2).
- Default Export Format: sets which format the Export functions should use by default.
- Allow Send/Get: Unchecking this option will disable the Send/Get buttons in the Configuration view.
- Start in Monitoring Mode: If this is checked, EMT will automatically switch to the Monitoring View when launched.
- AutoConnect: When EMT is launced and the database is loaded, EMT will automatically connect to the Controller(s) and start monitoring.
- Display Alerts and Warnings: When this is unchecked, EMT will not display the popup windows when Faults and Warnings arrive
Availability
This function is available from Exigo Management Tool (EMT) 1.5.3.0 and newer.
